Dashboard
The Dashboard provides a summary of matched parts and manufacturers, life cycle health and availability of active parts, and environmental compliance in graphical form. Use the Dashboard to quickly view the overall health of the BOM.
View the various reports as individual tabs, or in a single view.
Using the Part Alerts pane in the lower-right of the Dashboard: Summary tab and in the Single Page view, select a period for which to view part Smart Alert counts.
The View a summary tab includes data from the Matching, Life Cycle, and Environmental views, which are detailed below.
- With a single BOM displayed, click Dashboard > Summary.
Information on parts, manufacturers, life cycle, overall assembly risk, and part details are displayed. hyper-links in each section link directly to views of the specific data, where you view data and perform functions specific to the link. For example, resolve unmatched parts and manufacturers, and view cycle data for parts.
- With a single BOM displayed, click Dashboard > Mfr Prefs.
View summary details on parts with various manufacturer preference status (total parts with preferred manufacturers, etc). The individual bars in the bar chart are colored according to the manufacturer preferences icon color:
 - Approved
 - Approval Required
 - Not Approved
 - Do Not Use
 - Other
View a part Smart Alert that includes data from the Matching, Life Cycle, and Environmental views, which are detailed below.
- Using the drop-down list that appears in the Part Alerts pane, select a time range over which to view the parts that have been affected in a given period.
The Smart Alert period you select is automatically decremented by one.
This is to account for the fact that alerts are published the day before they are sent. For example, if you select seven days from the drop-down list, the actual duration of the Smart Alert period is the current date minus eight.
- Using the Part Alerts pane, click the hyper-linked number after one of the part Smart Alert statuses to display the Part Alerts tab for the current BOM.
Data in the Assembly Life Cycle Risk Score is calculated when the BOM is imported or re-processed.
- With a single BOM displayed, click Dashboard > Matching.
View details on manufacturer and part matching including the following:
- The number of matched, unmatched, and ignored manufacturer name or part numbers records, as well as those with exceptions, such as partial matches.
- The number of manufacturer names or part numbers that matched entries in your KB, which is a listing of all manufacturers and part exceptions for your account. After saving a KB exception, parts or manufacturers on the list no longer require you to explicitly match them.
- For parts, there is an additional indicator of the number of part numbers that were automatically matched.
- With a single BOM displayed, click Dashboard > Life Cycle.
View life cycle risk, which includes details for parts including the overall BOM life cycle health, whether there are multiple sources for replacement parts, whether parts are active or discontinued, and more.
Create a report of the information that appears in the View Single BOM > Dashboard tab. This includes all of the same tables and charts that appear when you select the View as Single Page option on the toolbar. The PDF is created behind the scenes so that it does not interrupt your work.
- With a single BOM displayed, click Dashboard > Create Report.
The Create Single BOM Dashboard Report confirmation window appears.
- Click Okay.
To display this and other reports you created, select REPORTS > View All Reports and from the Filter drop-down column header, click Show My Reports as depicted below.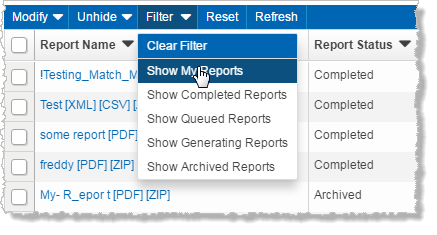
- With a single BOM displayed, click Dashboard > View as Single Page.
Display the separate tabs (Summary, Matching, Life Cycle, and Environmental) in a single page.